")
")
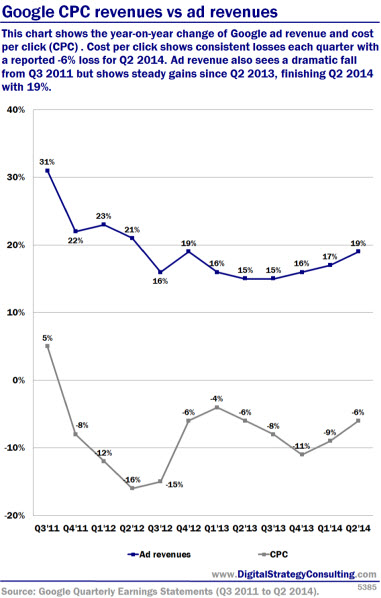
This chart shows the year-on-year change of Google ad revenue and cost per click (CPC) . Cost per click shows consistent losses each quarter with a reported -6% loss for Q2 2014. Ad revenue also sees a dramatic fall from Q3 2011 but shows steady gains since Q2 2013, finishing Q2 2014 with 19%. View […]
This chart shows the year-on-year change of Google ad revenue and cost per click (CPC) . Cost per click shows consistent losses each quarter with a reported -6% loss for Q2 2014. Ad revenue also sees a dramatic fall from Q3 2011 but shows steady gains since Q2 2013, finishing Q2 2014 with 19%.